47 Doctor Demographics & Statistics In The U.S.
Find the most up-to-date doctor demographics, statistics, and facts.

Key Doctor Statistics
- In the United States, there are more than 55,501 doctors employed in various fields. Many of them work in hospitals, clinics, and private practice.
- More women are working as doctors than men. They make up 54.2% of all employed physicians, while men account for 45.8% of the population.
- Doctors come from various backgrounds, races, and ethnicities, though whites comprise 65.6% of American physicians with medical degrees.
- There are 18% of Asians in the United States who work as doctors, which has risen steadily over the years.
- Hispanics or Latinos represent 8.9% of the employed physician population in America, with a sizable gain in the last 20 years.
- Black or African Americans represent 4.7% of all physicians, though the percentage is expected to grow in the following decade as more black people enter the medical field.
- The city where physicians and doctors are most sought after, according to medical professionals, is Atlantic City, New Jersey.
- The salary for physicians has grown exponentially in Midwestern states, where Green Bay, Wisconsin pays a yearly wage of more than $250,000 to the average doctor. This is the highest in the United States.
Important Doctor Statistics
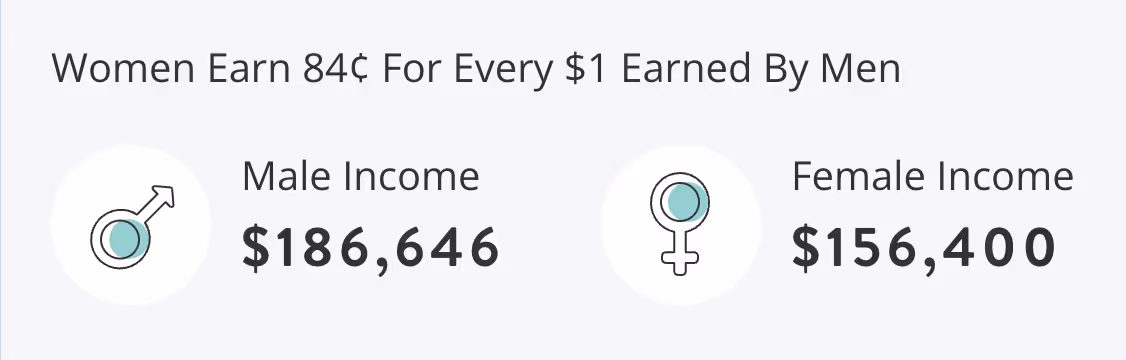
- Although women represent over half of all doctors in America, they make up only 84% of what men earn, according to one 2021 study.
- For living conditions, quality of life, and balance between working and living, Wisconsin ranks at the top as the best place for a doctor to live.
- Private companies are shown to have a preference for more than half of all doctors in the workforce, with 59% of them employed at private companies. These include private hospitals and clinics.
- On average, the number of hours a physician works every week is 51, 11 more than the 40-hour average of most Americans.
- Although doctors often find themselves busy tending to patients and directing nurses that work with them, nonclinical paperwork makes takes up a majority of their time, with 25% of their day spent filing, writing, and administering documents.
- From 2020 to 2030, the employment of doctors is anticipated to increase by $3 every year.
- Doctors differentiate themselves from nurses by holding medical degrees, with 35% having a bachelor's and 30% holding a doctorate. 9% in the field have a master's degree.
- The average pay of a doctor in the United States is $511,000 annually, though the profession they hold can vary in payment. For instance, orthopedics earn more than other physicians.
- All expenditures related to clinical and physician services are growing, with a climb to $800 billion in 2020 and significant increases in the following decade.
- For every 1,000 patients in America, 2.6 doctors are working to assist them.
- Some doctors have physician assistants working underneath them, 30% to be exact. 35% rely on nurse practitioners instead, with 76% claiming that such services have significantly improved in the last couple of years. 75% of doctors that rely on such workers are satisfied with the jobs they perform for them.
- 61% of US doctors have a work day that lasts anywhere from nine to 12 hours.
- When they're not supervising people under their wing, doctors are seeing patients, with 20 per day being the average number visiting. The average time it takes with every patient they see is 20 minutes.
- 29% of the patients doctors see rely on Medicare, 15% rely on Medicaid, and 11% pay for medical services by cash. Private insurance is used by 45% of their patients.
- 12% of doctors have reported a yearly boost in their compensation, though 45% reported decreases in their pay. Another 43% have no changes at all.
- 3 out of every 4 doctors knew that they wanted to be doctors before their 20th birthday.
- The average GPA of undergraduates studying for a medical degree is 3.88, with an average MCAT score of 519 out of 528.
- Between 2017 and 2018, 19,553 students graduated from a medical school in the United States, an 8% increase from 2013 to 2014.
- The average debt of a person just completing medical school is $192,000, which includes undergraduate debt.
- The average graduate spends 2 to 7 years in residency, predicated on their specialty field.
- In the United States, there are 472,560 primary care doctors.
- Specialist physicians number 518,128 in America, with approximately 175,000 doctors in private practice.
- For every 100,000 people in the United States, there are 295 actively licensed physicians and doctors.
- The state of California has the greatest number of doctors, with New York and Texas following close behind.
- 26% of all physicians in the medical field are self-employed, with 69% being employed by an organization.
- Primary care physicians have a yearly average salary of $223,000, with $329,000 earned for specialty care physicians.
- 56% of all physicians spend between 35 to 40 hours of their workweek seeing patients and tending to their needs.
- Throughout the country, patients receive between 13 to 24 minutes with 62% of doctors.
- Paperwork is a big job for doctors, with 38% of them spending between 10 to 19 every week filing paperwork, filling out forms, and administering reports to different people.
- 32% of doctors spend 20 or more hours every week on paperwork.
- Physician burnout is a big problem for doctors, with 27% having burnout due to the number of strict rules and regulations that they must adhere to.
- 16% of doctors experience burnout from having to work long hours every week.
- 15% of physicians get burned out from having to deal with difficult, rude, and uncooperative patients.
- In total, 44% of doctors and physicians have experienced burnout at some point during their work.
- Overall, burnout among doctors has decreased, with a 10% reduction reported between 2014 and 2017.
- 59% of doctors claim that too much bureaucracy between doing charts and filing paperwork is the main cause of their burnout.
- 34% of doctors claim that spending too much time in their offices is the main catalyst for their burnout.
- 7 out of 10 doctors think that Electronic Health Records, or EHRs, are a primary contributor to their burnout, with 6 out of 10 thinking that EHRs should be discontinued.
- 90% of doctors are satisfied with the career choice that they made.
- Doctors that try to prevent themselves from rushing are 40% more likely to have a more fulfilling workday than those that don't.
- The happiest doctors are plastic surgeons, accounting for 41% of those employed, while 40% work in public health and preventive medicine. Ophthalmologists were the third most happy, making up 39% of doctors in a survey.
- 27% of doctors claim that the most rewarding segment of their job is the gratitude they get from patients, and the relationships they build with them.
- 43% of doctors take between 3 to 4 weeks of time off for vacation each year. 28 of them take between 1 to 2 weeks of vacation time.
- Between 2016 and 2026, the employment of physicians and surgeons is anticipated to grow by 13%, which is faster than the average for every other major occupation.
- 16% of physicians recommend the profession to other people.
How Many Doctors Are There In The U.S?
There are over 55,501 doctors currently employed in the U.S.
Doctor Statistics By Gender
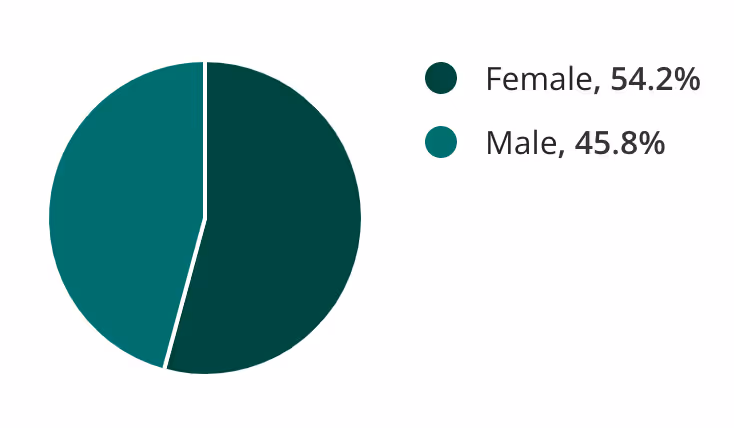
- Currently, there are 54.2% female doctors and 45.8% male doctors.
- The average yearly income for a male doctor is $186,646, while women take home $156,400 on average.
- Between 2010 and 2019, the number of male doctors declined from 53.36% to 47.44%.
- Between 2010 and 2019, female doctors rose from 46.64% to 52.56%.
- 98% of women work as midwives and staff nurses, with just 2% of men working in the profession.
- Some doctors are perinatal nurses, with women comprising 97% of the total in comparison to men's 3%.
- Women in the therapeutic dietitian field make up 97% of the total, while males are 3%.
- There are 25% of women working as radiology resident doctors, while men make up 75% of those employed.
- 24% of women are optometrists, and men are 76%.
- 18% of women are flight surgeons, while men represent 82%.
Gender Pay Gap For Doctor
On average, women make 84 cents for every dollar earned by a male doctor.
Doctor Gender By Year
Doctor Statistics By Race
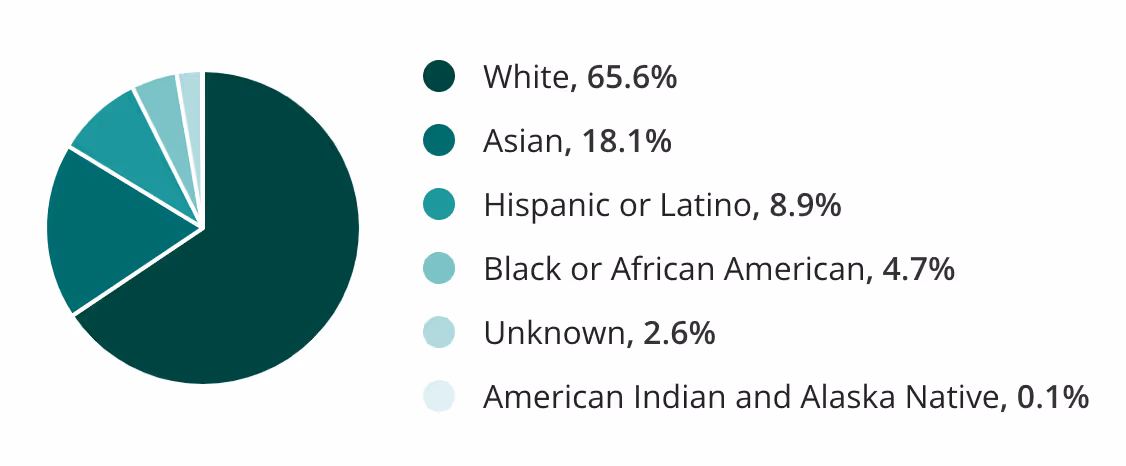
- Whites make up a majority of the physician population in the United States. Currently, 65.6% of white people work as physicians.
- Doctors of Asian ethnicity make up 18.1% of all physicians in America.
- Hispanics or Latinos account for 8.9% of the total number of doctors.
- African American doctors in the field represent 4.7% of the population.
- Not all doctors specify their ethnicity or race, with 2.6% of them being unknown or undefined.
- 0.1% of doctors are Native American or Alaska Native.
- Between 2010 and 2019, the number of white doctors decreased from 67.14% to 65.62%.
- The number of black doctors decreased slightly between 2010 and 2019, from 5.17% to 4.71%.
- Asian doctors increased in employment, from 16.72% in 2010, to 18.06% in 2019.
- The number of Hispanic doctors increased only slightly, though remaining at 8% from 2010 to 2019.
- In comparison to other ethnicities, Asian doctors have the highest annual salary, earning $178,888 every year.
- Black American doctors have the lowest average salary, earning $160,893 per year.
- Hispanic or Latino doctors have an average salary of $168,482.
- White doctors earn an annual salary of $178,354.
Doctor Race By Year
Doctor Statistics By Age
- The average age of all doctors is 48.6 years old.
- The average age of all white male doctors in the United States is 51.
- 50 is the average age of most African American doctors in America.
- Asian male doctors have an average age of 47.
- Hispanic or Latino male physicians have an average age of 49.
- Asian women have one of the lowest age averages for doctors, which is 44.
- Hispanic women working as doctors have an average age of 46.
- The average age of a black female physician in the US is 46.
- 47 is the average age of white female doctors in America.
- 20% of physicians in the United States are aged between 30 to 40 years old.
- 74% of physicians are 40 years old and above.
- 1% of physicians in the US are between 20 and 30 years old. Most in this age bracket are still in school completing their degrees.
Doctor Age By Race
Average Age Of A Doctor
The average age of a doctor is 48 years old, representing 75% of all doctors employed in the United States.
Doctor Employment Statistics
- Companies with fewer than 50 workers employ just 9% of all doctors in the US.
- 1% of doctors work with companies employing between 50 to 100 people.
- 36% of doctors work for organizations employing between 1,000 and 10,000 total employees.
- 22% of physicians work under companies with more than 10,000 people on staff.
- 59% of doctors are employed through private businesses.
- 12% of doctors work in the education field.
- 27% of physicians are employed in the public sector, such as public hospitals and clinics.
- 2% of all doctors work for the government, such as government-run institutions and health facilities.
- The healthcare industry hires the most doctors, accounting for 35% of all physicians.
- The education field employs 9% of all doctors, the second most popular industry for their employment.
- Many doctors are employed in the retail industry, comprising 8% of all doctors in the US.
- The unemployment rate for doctors decreased between 2010 and 2019, from 0.73% to 0.42%.
Doctor Unemployment Rate
Number Of Doctor Jobs In Each State
FAQs
Which state has the most doctors?
The state with the most doctors is California, with New York following close behind.
What percentage of doctors are Black?
4.7% of doctors in the United States are black or African American.
Are most doctors men or women?
The majority of doctors are women, making up 54% of the total number employed in the US.
References
Recent News
Related articles
.avif)
100+ YouTube Statistics, Facts & Demographics
In 2023, YouTube has over 2.5 billion monthly active users.

39 Teacher Statistics And Demographics
Find the most up-to-date teacher demographics and statistics that'll surprise you.

Twitter Statistics for Social Media Enthusiasts [2024]
Explore compelling twitter statistics, user demographics, content engagement, and future predictions.
.avif)
89 TikTok Statistics, Facts & User Demographics
New TikTok statistics show that TikTok has quickly become one of the most popular social media platforms, with users spending an average of 52 minutes per day scrolling through videos.

Key Tinder Statistics You Need to Know
Dive into the world of Tinder statistics - revealing insights on user demographics, engagement, and global trends.
.avif)
49 Telehealth Statistics & Telemedicine Trends
Telehealth statistics show that the use of virtual care is 38 times higher than before the COVID-19 pandemic.

Teacher Salary By State: Highest-Paid Teachers By State
Today we'll breakdown a teacher's salary by state, as well as the highest-paid teachers by state.

121 Social Media Addiction Statistics Worldwide
Did you know that around 70% of teens and young adults in the US have a social media addiction?

57 Scholarship Statistics, Facts & Demographics
Did you know over 1.7 million scholarships are awarded annually? Keep reading to find more scholarship statistics.

Average Screen Time Statistics & Facts (Usage)
Did you know people spend 6 hours 58 minutes on screens everyday? Find more screen time statistics below.

59 Physical Therapy Statistics, Facts & Demographics
There are 578,565 people employed in the physical therapy industry in the US as of 2022. Find more physical therapy statistics and facts below.

Spotify Statistics: 79+ Intriguing Consumption Statistics in Music
Dive into the evolution of music with intriguing Spotify statistics; from user engagement to financial performance.