39 Teacher Statistics And Demographics
Find the most up-to-date teacher demographics and statistics that'll surprise you.

Key Teacher Demographics & Statistics
- There are more than 4,492,114 teachers employed in the U.S.
- 74.3% of all teachers are women, and 25.7% are men.
- The average age of an employed teacher is 42 years old.
- It's most common that teachers are White (72.3%), followed by Hispanic or Latino (12.0%), Black or African American (10.1%), and Asian (3.4%).
- Teachers are most in-demand in New York, NY.
- Baltimore, Maryland pays an annual average salary of $61,238 to teachers, making it the city with the highest teacher salary.
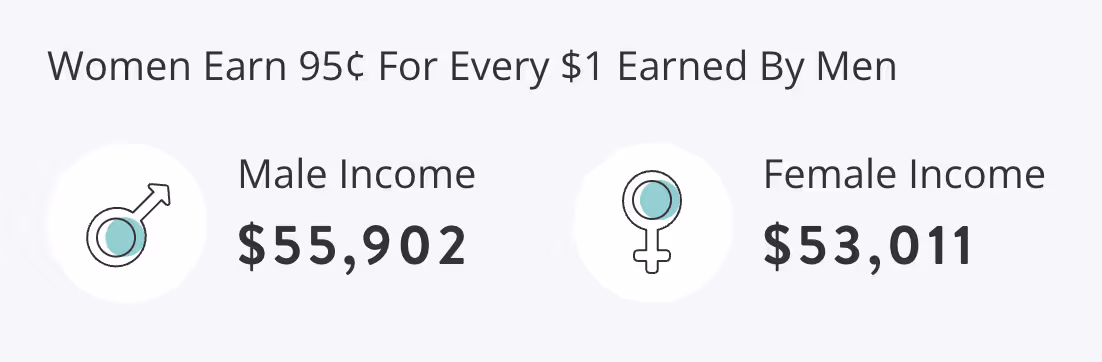
- Teachers who are women earned 95% of what male teachers earned in 2021.
- Maryland is the best and most high-paying state for teachers to live.
Teacher Statistics By Gender
74.3% of teachers are women and 25.7% of teachers are men.
Women earn 95¢ for every $1 earned by men in the teaching industry.
Teacher Gender By Year
Average Age Of A Teacher
The average age of an employed teacher is 42 years old.

Teacher Age
Teacher Age By Race
Teacher Statistics By Race
The most common race among teachers is White, which makes up 72.3% of all teachers. 12.0% of teachers are Hispanic or Latino, and 10.1% are Black or African American.
Teacher Race Breakdown
Teacher Race By Year
Teacher Statistics By Education
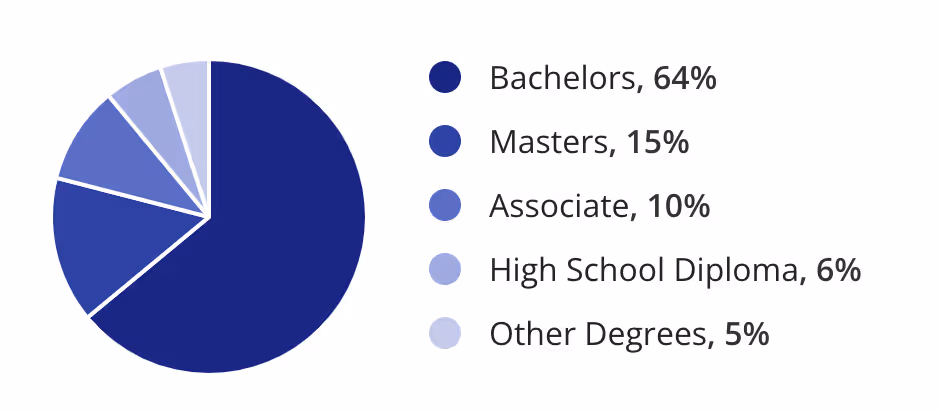
The most common degree for teachers is a bachelor's degree, as 64% of teachers earn that degree. Second is master's degree with 15% of teacher's earning that degree. Finally, 10% of teachers earn an associate degree.
Teachers By Education
Teacher Wage Gap By Education
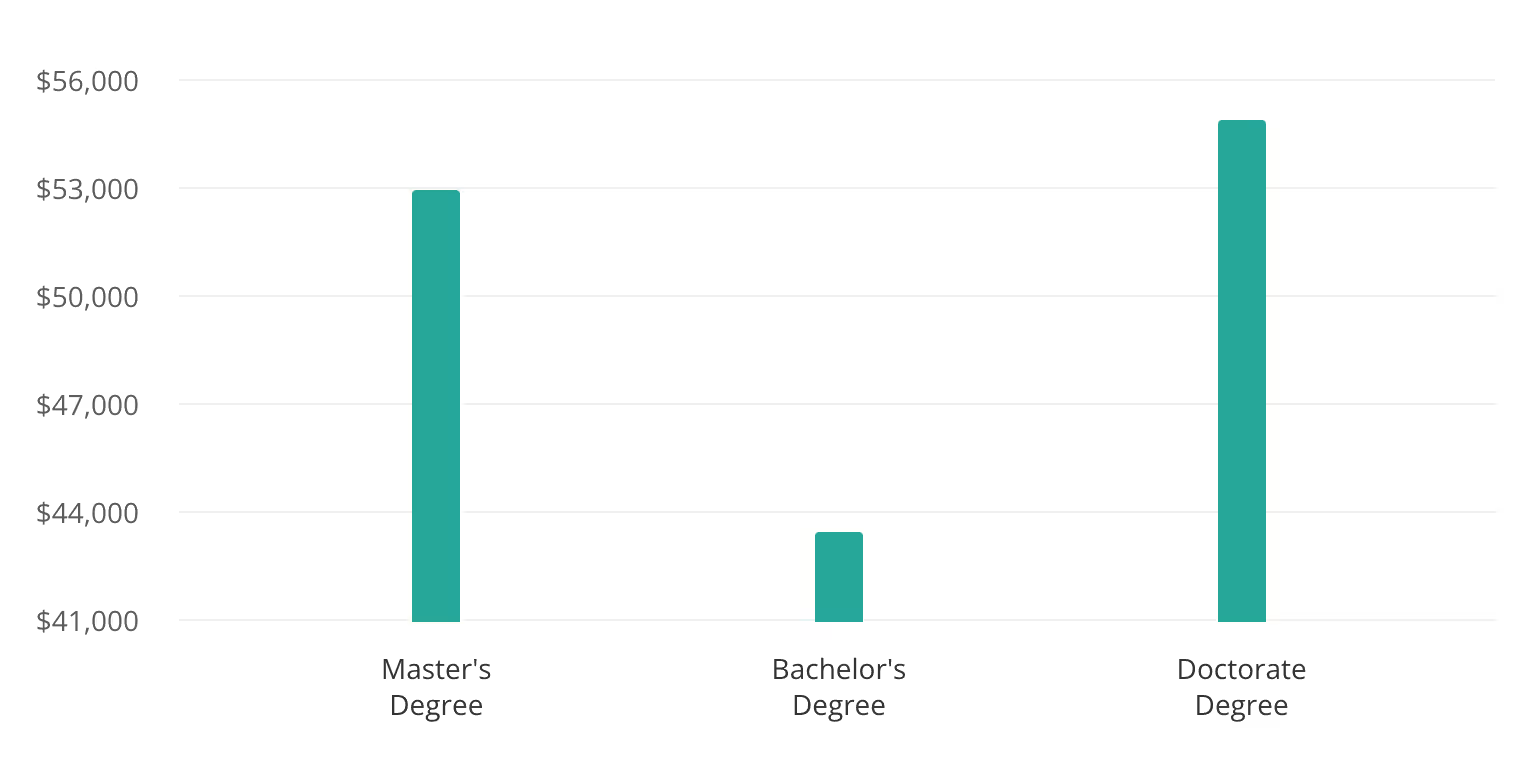
Teachers with a Doctorate degree earn more than those without, at $54,967 per year. Teachers with a Masters degree earn an average annual income of $53,011. Teachers with a Bachelors degree earn an average annual income of $43,512.
Teacher Employment Statistics
Company Size
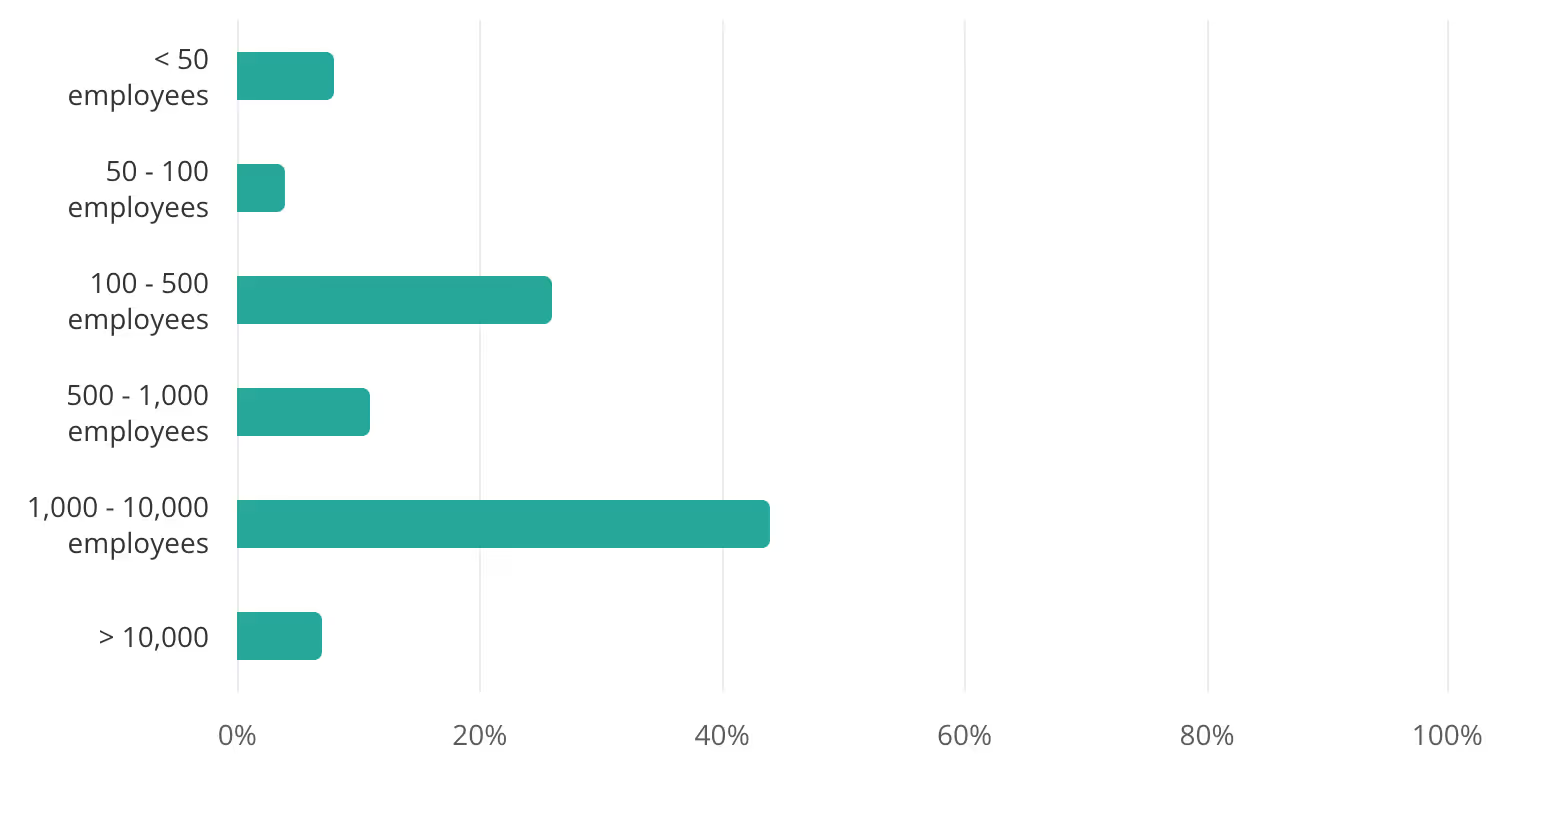
This chart shows the average size of companies that usually hire teachers.
Teacher Jobs By Employer Size
Types Of Companies Teacher Work In
Most teachers prefer to work at education companies over private companies.
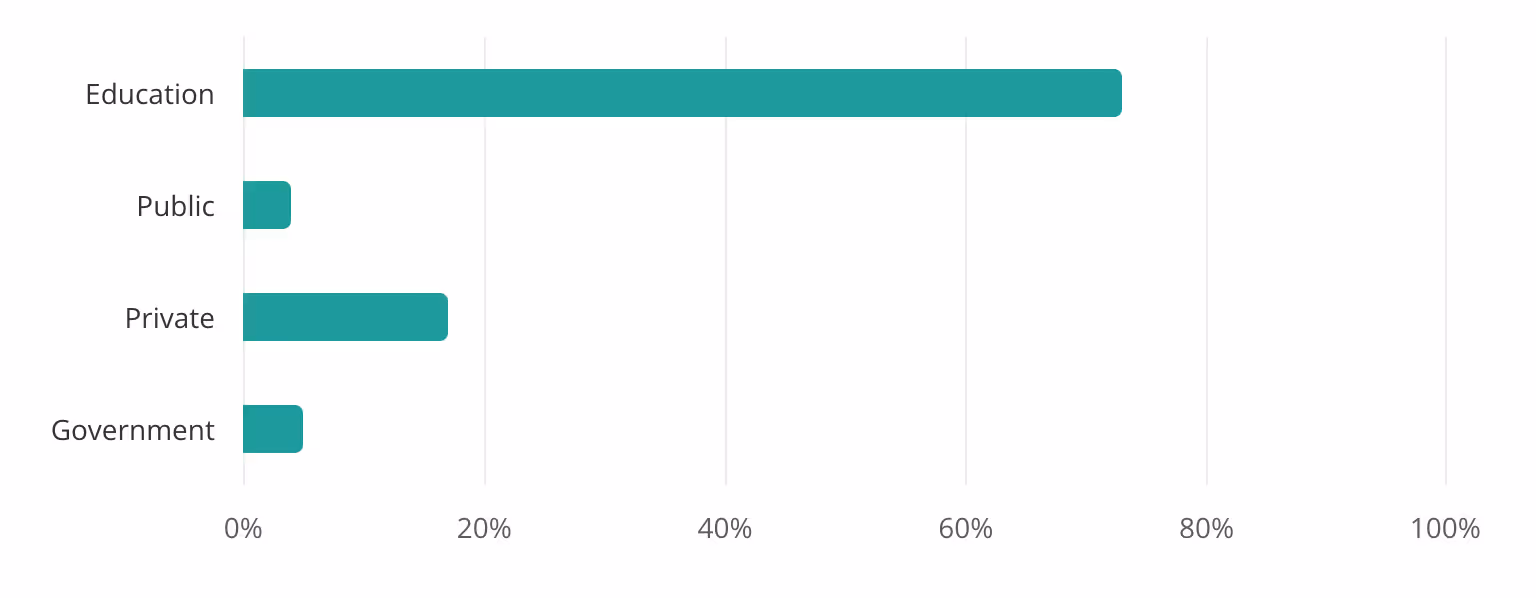
Teacher Jobs By Sector
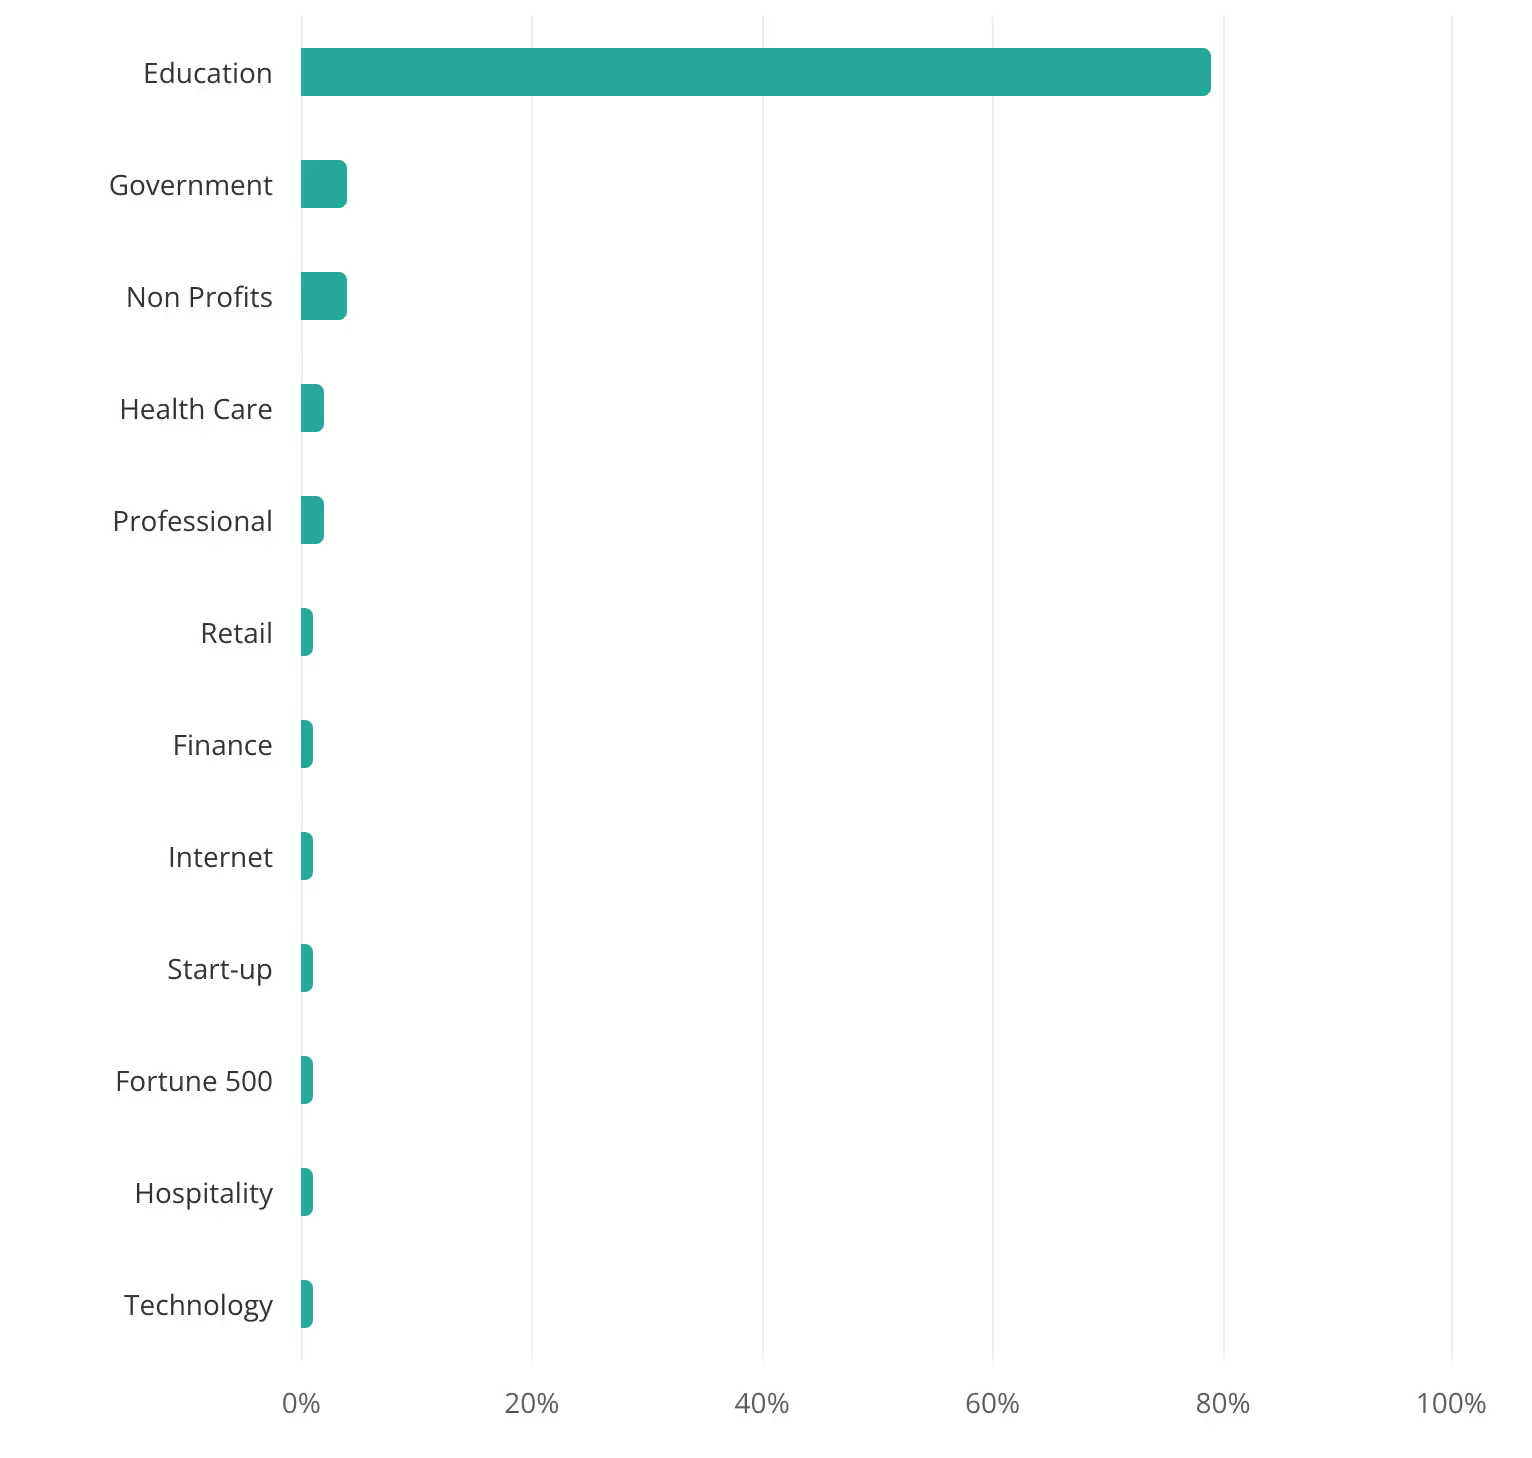
Top Industries Hiring Teachers
The industries with the most teachers include education, government and non profits.
Teacher Employment And Turnover Statistics
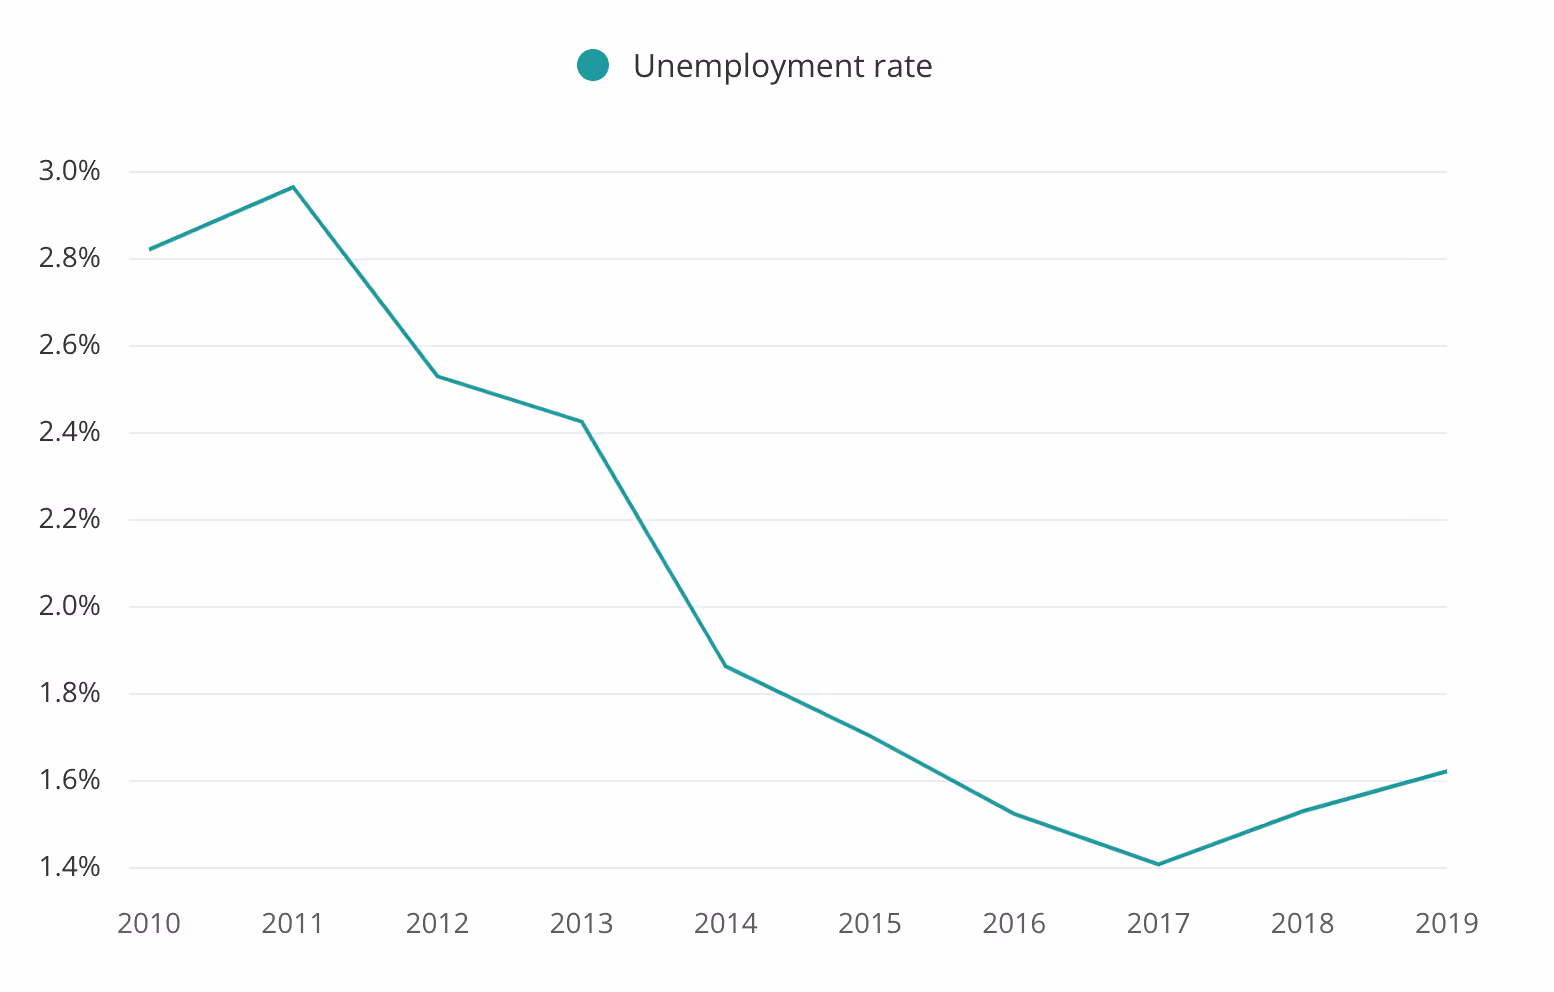
Teacher Unemployment Rate By Year
Teacher Unemployment Rate Over Time
Average Number Of Years A Teacher Stays In A Job
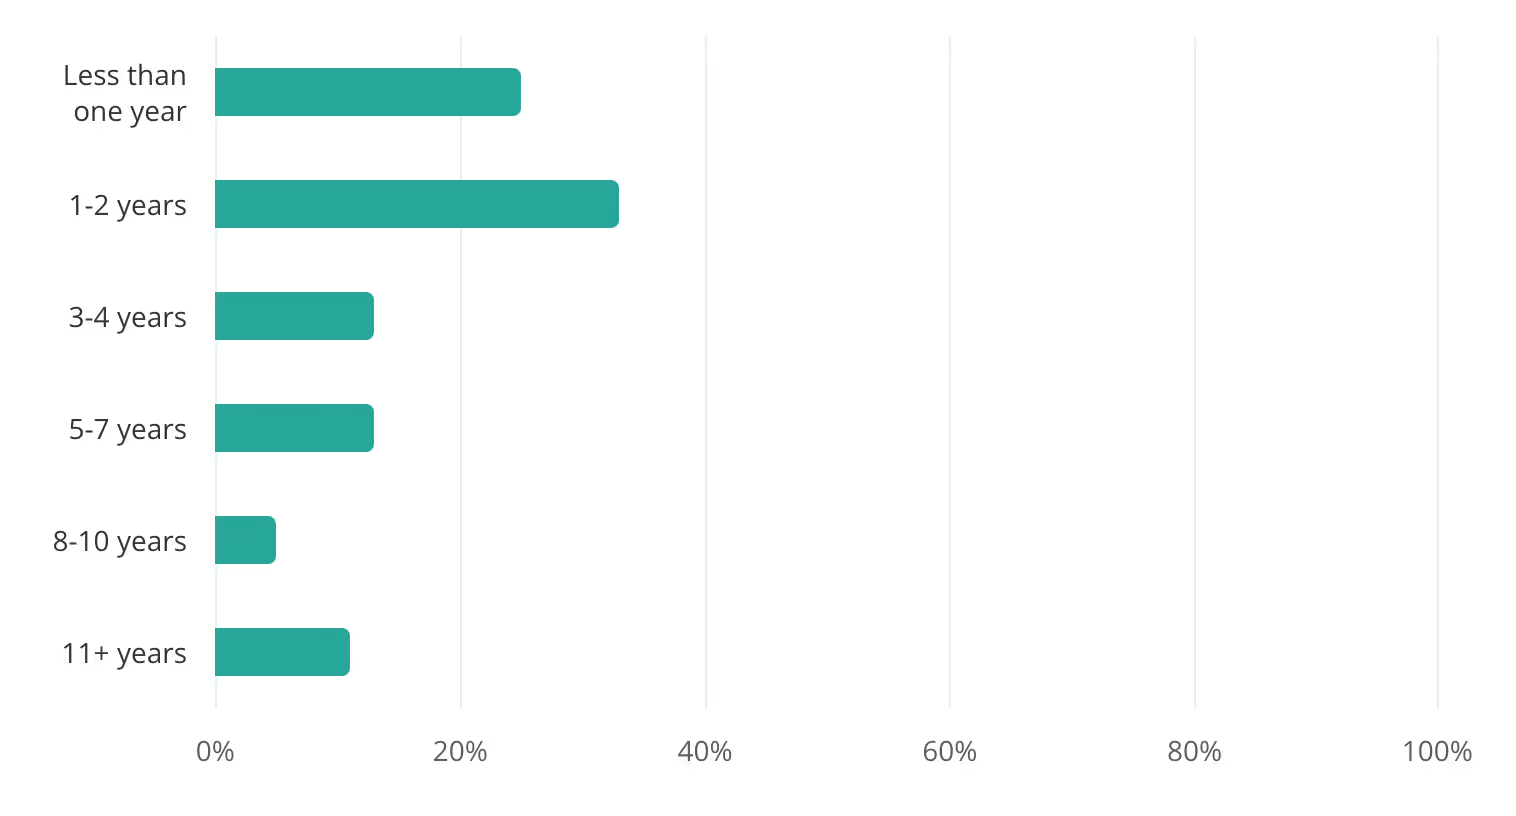
Teacher Tenure
FAQs
What percentage of teachers are female?
71.2% of teachers are female in the United States, up 3.8% compared to last years. That means there are 3,198.385 female teachers in the U.s. and 1,293,729 male teachers in the United States.
How many teachers are there in the U.S?
There are more than 4,492,114 teachers employed in the U.S.
What percentage of teachers are Black?
10.1% of teachers are Black or African American.
How old is the average teacher?
The average teacher is 43 years old. More than 5 out of 10 teachers are 40 years old or older, 28% are between 30-40 years old, and 13% are between 20-30 years old.
References
Recent News
Related articles
.avif)
100+ YouTube Statistics, Facts & Demographics
In 2023, YouTube has over 2.5 billion monthly active users.
39 Teacher Statistics And Demographics
Find the most up-to-date teacher demographics and statistics that'll surprise you.
Twitter Statistics for Social Media Enthusiasts [2024]
Explore compelling twitter statistics, user demographics, content engagement, and future predictions.
.avif)
89 TikTok Statistics, Facts & User Demographics
New TikTok statistics show that TikTok has quickly become one of the most popular social media platforms, with users spending an average of 52 minutes per day scrolling through videos.

Key Tinder Statistics You Need to Know
Dive into the world of Tinder statistics - revealing insights on user demographics, engagement, and global trends.
.avif)
49 Telehealth Statistics & Telemedicine Trends
Telehealth statistics show that the use of virtual care is 38 times higher than before the COVID-19 pandemic.

Teacher Salary By State: Highest-Paid Teachers By State
Today we'll breakdown a teacher's salary by state, as well as the highest-paid teachers by state.

121 Social Media Addiction Statistics Worldwide
Did you know that around 70% of teens and young adults in the US have a social media addiction?

57 Scholarship Statistics, Facts & Demographics
Did you know over 1.7 million scholarships are awarded annually? Keep reading to find more scholarship statistics.

Average Screen Time Statistics & Facts (Usage)
Did you know people spend 6 hours 58 minutes on screens everyday? Find more screen time statistics below.

59 Physical Therapy Statistics, Facts & Demographics
There are 578,565 people employed in the physical therapy industry in the US as of 2022. Find more physical therapy statistics and facts below.

Spotify Statistics: 79+ Intriguing Consumption Statistics in Music
Dive into the evolution of music with intriguing Spotify statistics; from user engagement to financial performance.