Average Screen Time Statistics & Facts (Usage)
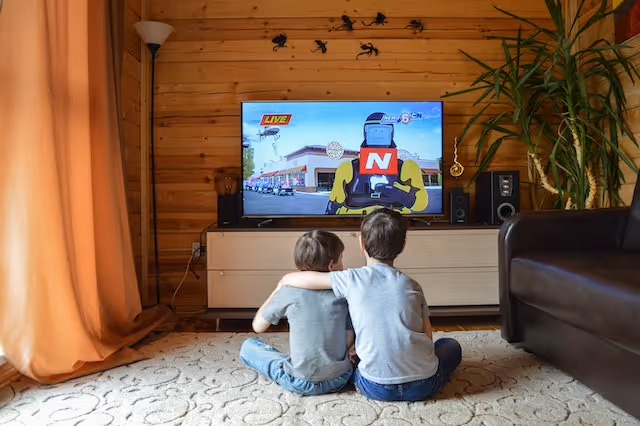
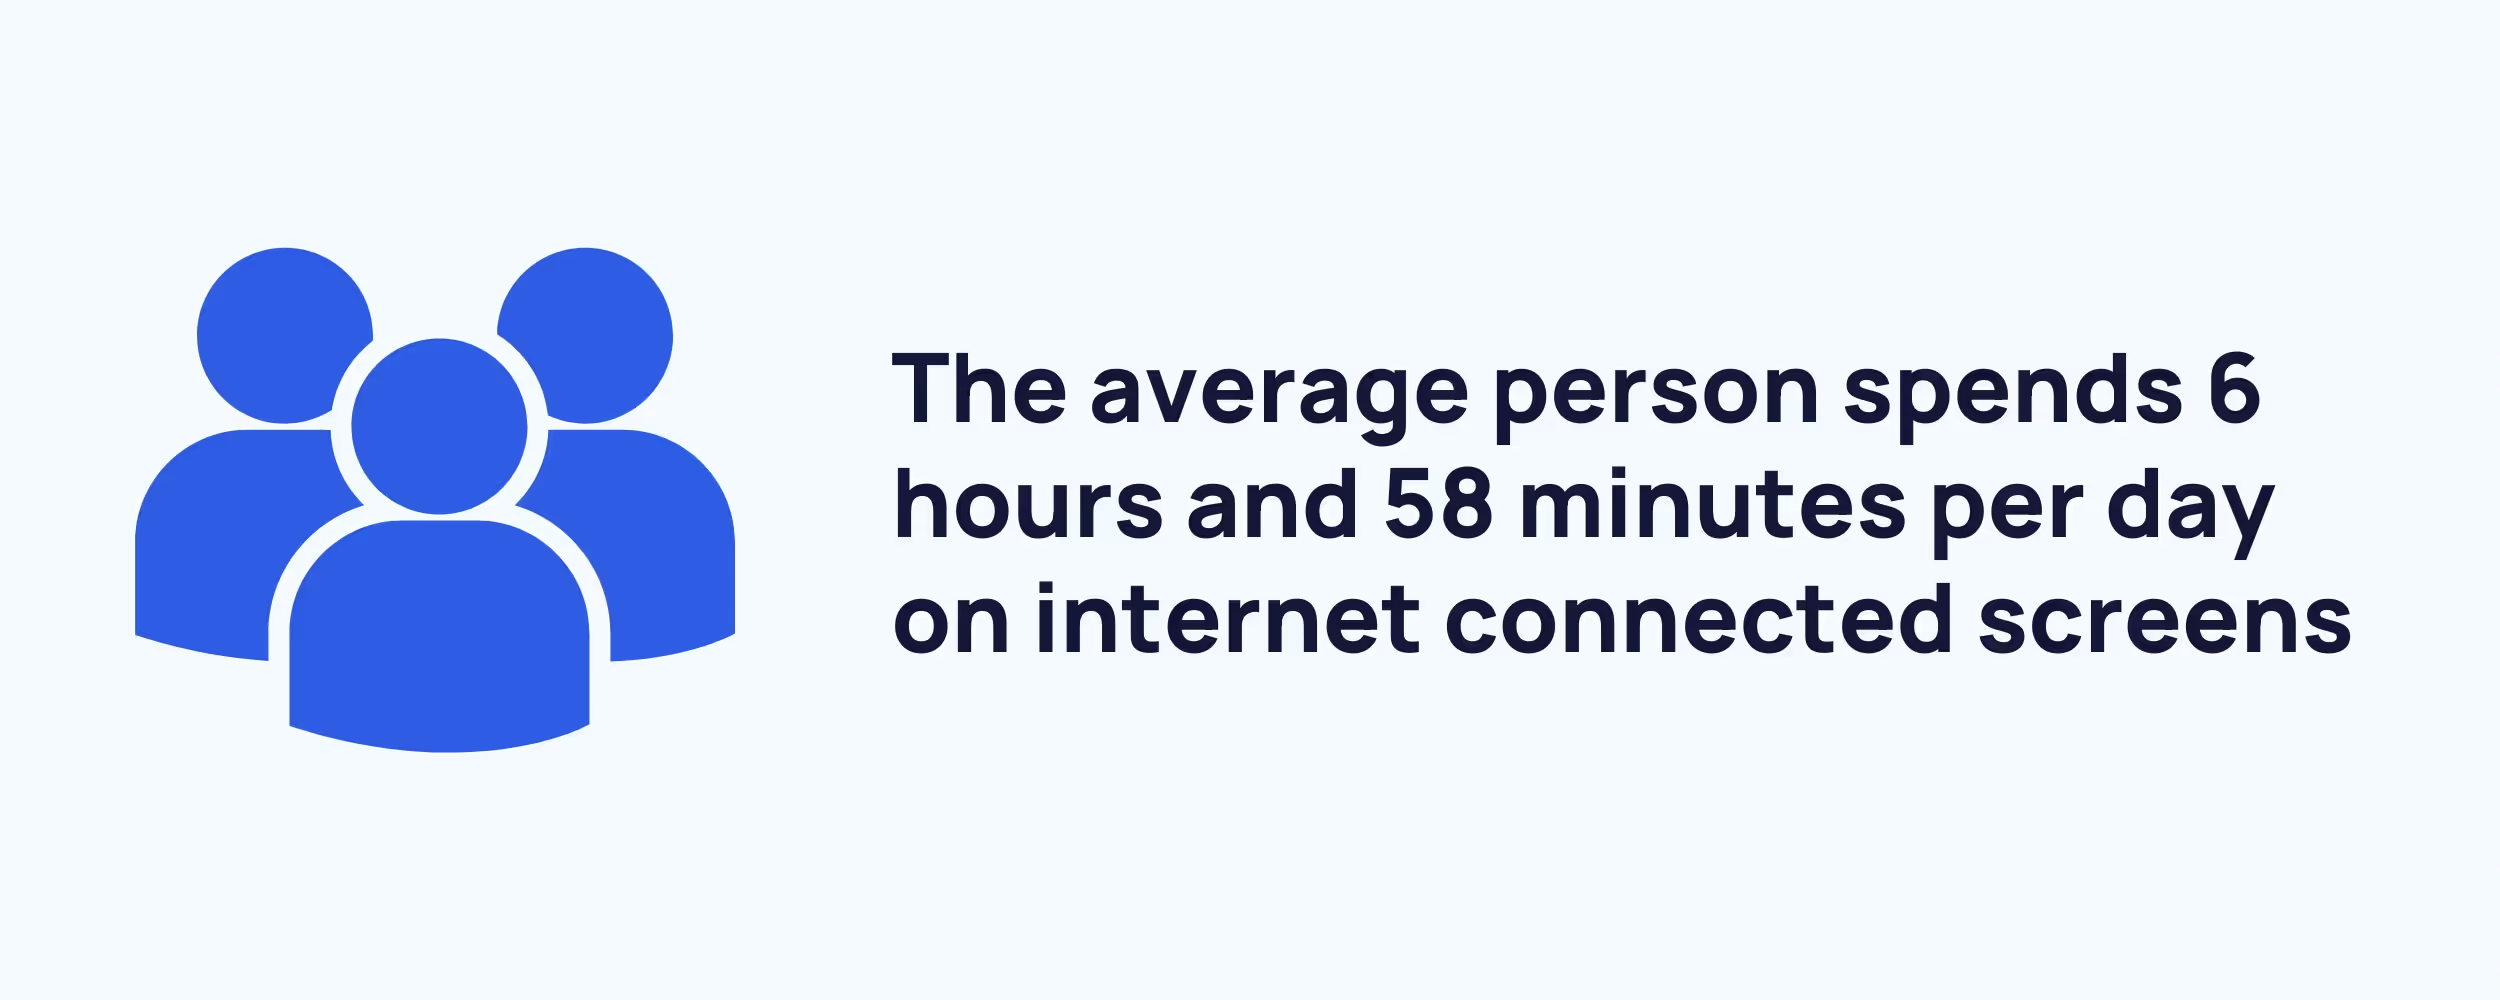
Did you know people spend 6 hours 58 minutes on screens everyday? Find more screen time statistics below.
Average Screen Time Usage Statistics 2023
- People have 6 hours 58 minutes of screen time per day.
- Daily screen time has increased by almost 50 minutes per day since 2013.
- The average American spends 7 hours and 4 minutes looking at a screen each day.
- Worldwide, the average user spends 2 hours and 51 minutes looking at their computer screens and 3 hours and 46 minutes looking at their mobiles.
- On average, 90.9% of people will use the internet to stream their favorite TV shows and movies.
- South Africans spend 10 hours and 46 minutes on screen per day.
- Almost half (49%) of 0 to 2-year-olds interact with smartphones.
- Gen Z averages around 9 hours of screen time per day.
- The biggest screen-time consumers are located in Africa, Asia, and South America.
Screen Time Statistics: Average Screen Time in US vs. The Rest of The World
Worldwide, the average person spends a total of 6 hours and 37 minutes looking at a screen each day (for internet-connected activities). The average American spends 7 hours looking at a screen each day. According to data from DataReportal, the average American spends 6 hours and 59 minutes looking at a screen every day.
Here’s an overview of the average internet-connected screen time since 2013:
The average person spends up to 40% of their waking hours looking at a screen.
Source: Data Reportal, Data Reportal, DigitalInformationWorld
US Average Screen Time
The average screen time in the United States is 7 hours 4 minutes per day, that's 7 minutes more than the global average according to Comparitech data.

Here’s the full breakdown of how the average US teen distributes their daily screen time:
Sources: Comparitech
Screen Time Changes Over Time
Here’s the rate of change between average screen time in 2021 and 2022 for these countries:
Average Screen Time By Region
Screen time varies significantly by region. According to recent records from 43 nations, South Africa is the country with the most screen time consumption per day.
Average Screen Time Allocation Per Day
Below are figures for global average screen time allocation per day:
Screen Time By Age
Age is an important factor in screen time consumption. Around 3 in 4 of parents with a child aged 2 or younger claim their child watches TV.
Unfortunately, 90% of older children spend time watching a TV screen.
Impact Of Screen Time
Data from a survey of 2,000+ US adults showed that less than 50% the time spent on screens is believed to be productive.
Recent News
Related articles
.avif)
100+ YouTube Statistics, Facts & Demographics
In 2023, YouTube has over 2.5 billion monthly active users.

39 Teacher Statistics And Demographics
Find the most up-to-date teacher demographics and statistics that'll surprise you.
Twitter Statistics for Social Media Enthusiasts [2024]
Explore compelling twitter statistics, user demographics, content engagement, and future predictions.
.avif)
89 TikTok Statistics, Facts & User Demographics
New TikTok statistics show that TikTok has quickly become one of the most popular social media platforms, with users spending an average of 52 minutes per day scrolling through videos.

Key Tinder Statistics You Need to Know
Dive into the world of Tinder statistics - revealing insights on user demographics, engagement, and global trends.
.avif)
49 Telehealth Statistics & Telemedicine Trends
Telehealth statistics show that the use of virtual care is 38 times higher than before the COVID-19 pandemic.

Teacher Salary By State: Highest-Paid Teachers By State
Today we'll breakdown a teacher's salary by state, as well as the highest-paid teachers by state.

121 Social Media Addiction Statistics Worldwide
Did you know that around 70% of teens and young adults in the US have a social media addiction?

57 Scholarship Statistics, Facts & Demographics
Did you know over 1.7 million scholarships are awarded annually? Keep reading to find more scholarship statistics.
Average Screen Time Statistics & Facts (Usage)
Did you know people spend 6 hours 58 minutes on screens everyday? Find more screen time statistics below.

59 Physical Therapy Statistics, Facts & Demographics
There are 578,565 people employed in the physical therapy industry in the US as of 2022. Find more physical therapy statistics and facts below.

Spotify Statistics: 79+ Intriguing Consumption Statistics in Music
Dive into the evolution of music with intriguing Spotify statistics; from user engagement to financial performance.