Average Screen Time Statistics & Facts (Usage)
Did you know people spend 6 hours 58 minutes on screens everyday? Find more screen time statistics below.
Average Screen Time Usage Statistics 2023
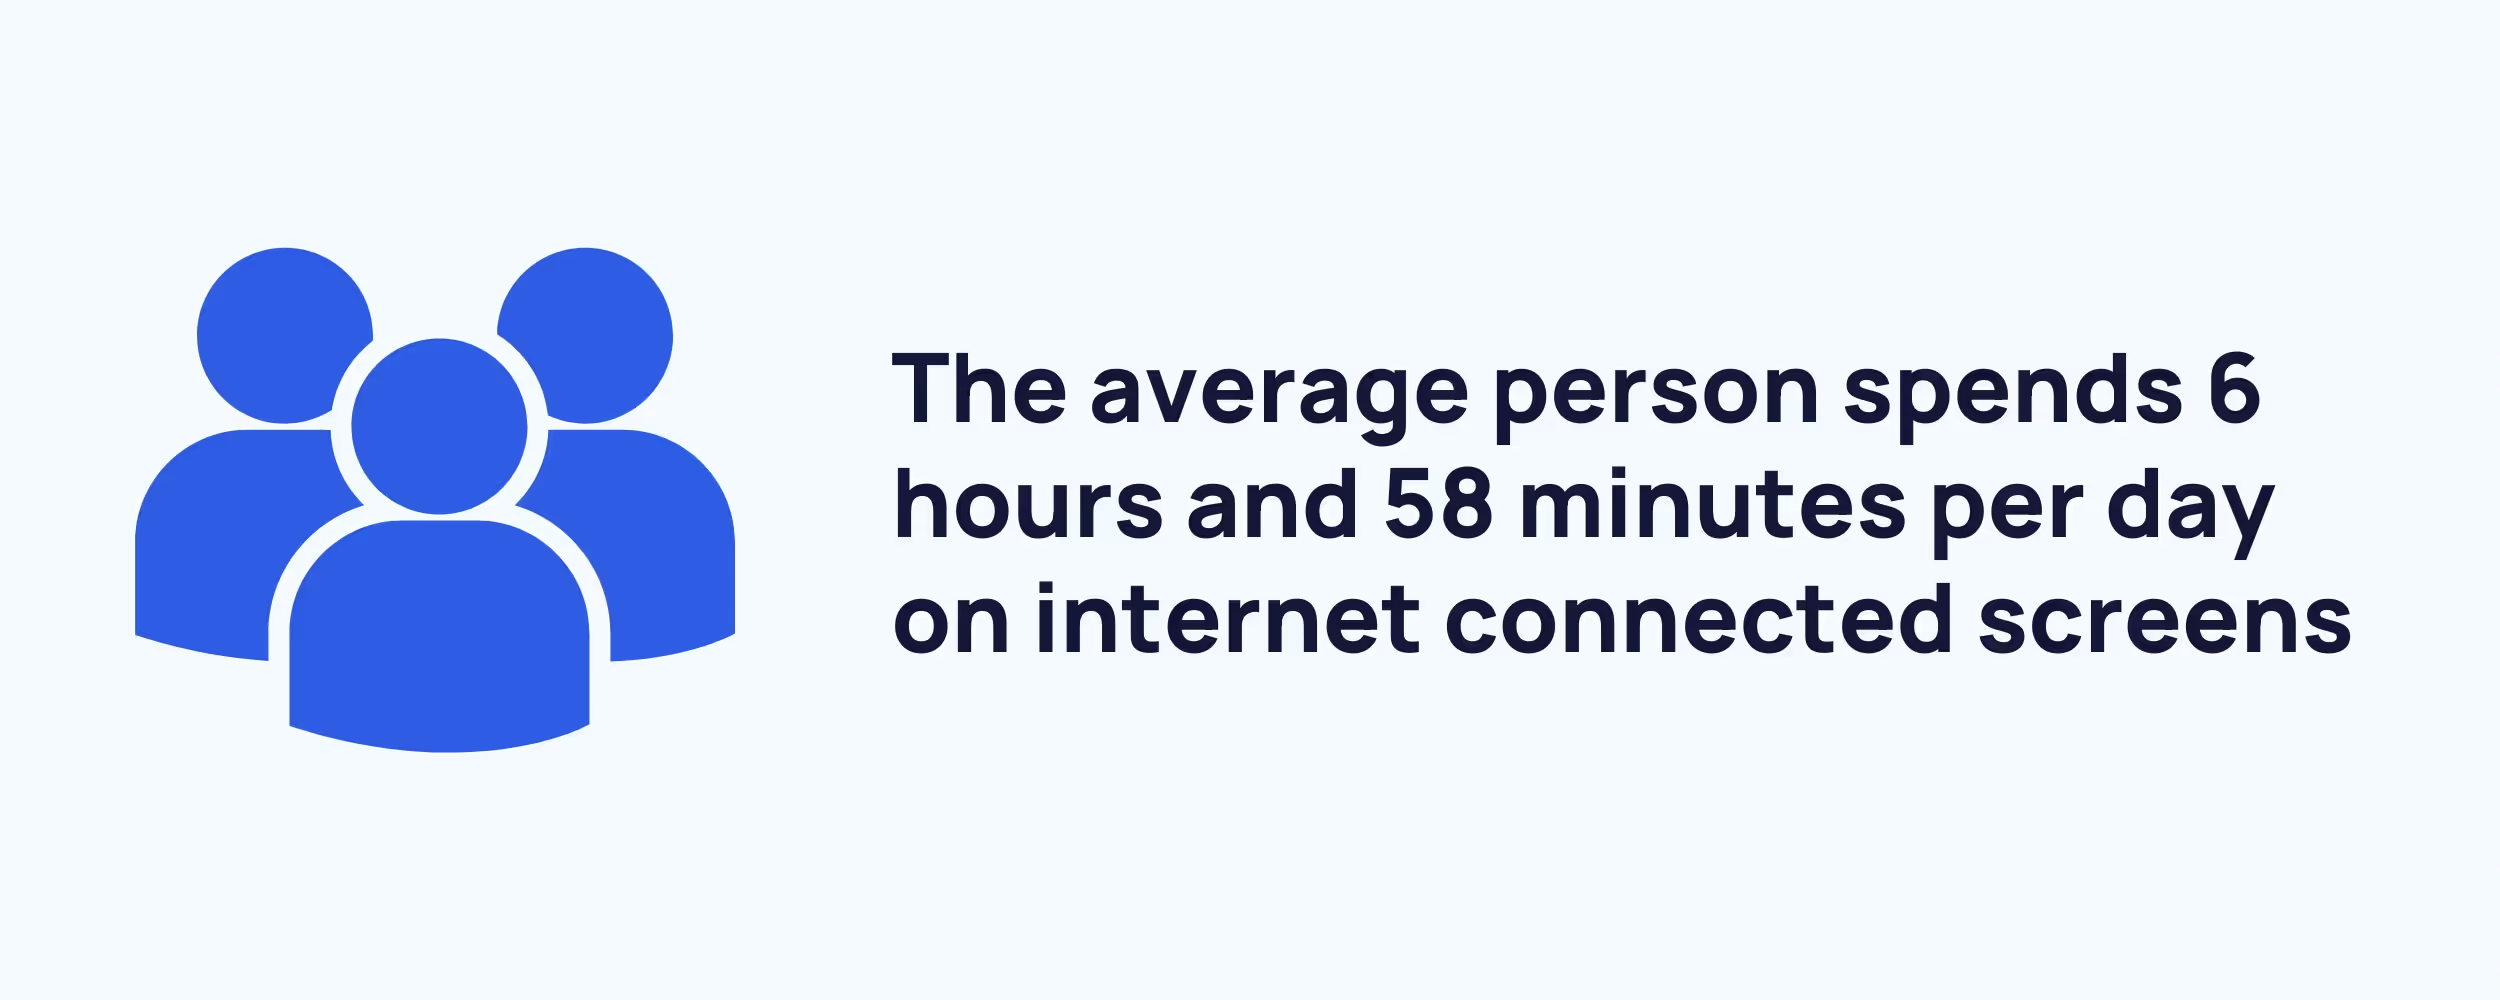
- People have 6 hours 58 minutes of screen time per day.
- Daily screen time has increased by almost 50 minutes per day since 2013.
- The average American spends 7 hours and 4 minutes looking at a screen each day.
- Worldwide, the average user spends 2 hours and 51 minutes looking at their computer screens and 3 hours and 46 minutes looking at their mobiles.
- On average, 90.9% of people will use the internet to stream their favorite TV shows and movies.
- South Africans spend 10 hours and 46 minutes on screen per day.
- Almost half (49%) of 0 to 2-year-olds interact with smartphones.
- Gen Z averages around 9 hours of screen time per day.
- The biggest screen-time consumers are located in Africa, Asia, and South America.
Screen Time Statistics: Average Screen Time in US vs. The Rest of The World
Worldwide, the average person spends a total of 6 hours and 37 minutes looking at a screen each day (for internet-connected activities). The average American spends 7 hours looking at a screen each day. According to data from DataReportal, the average American spends 6 hours and 59 minutes looking at a screen every day.
Here’s an overview of the average internet-connected screen time since 2013:
The average person spends up to 40% of their waking hours looking at a screen.
Source: Data Reportal, Data Reportal, DigitalInformationWorld
US Average Screen Time
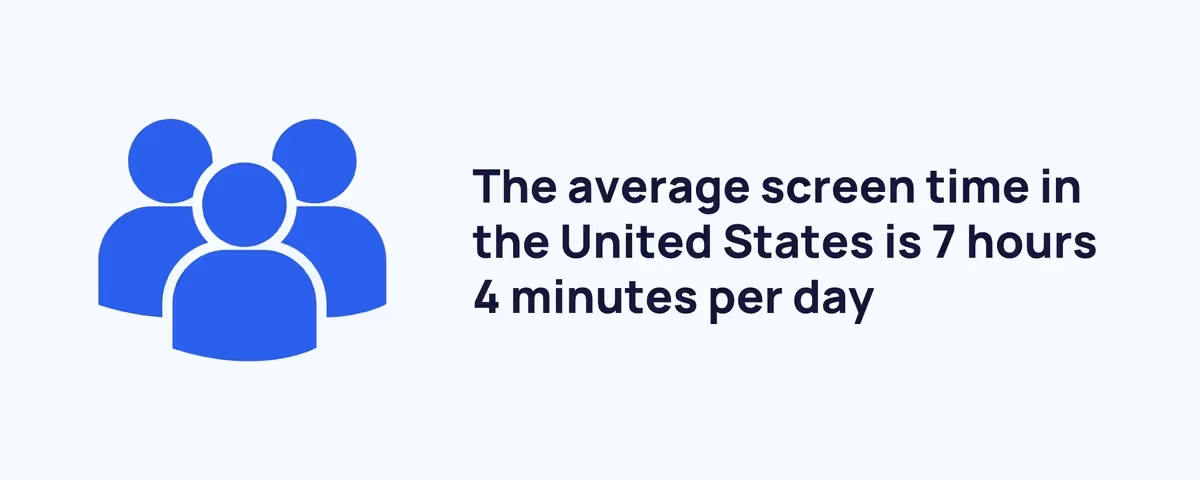
The average screen time in the United States is 7 hours 4 minutes per day, that's 7 minutes more than the global average according to Comparitech data.
Here’s the full breakdown of how the average US teen distributes their daily screen time:
Sources: Comparitech
Screen Time Changes Over Time
Here’s the rate of change between average screen time in 2021 and 2022 for these countries:
Average Screen Time By Region
Screen time varies significantly by region. According to recent records from 43 nations, South Africa is the country with the most screen time consumption per day.
Average Screen Time Allocation Per Day
Below are figures for global average screen time allocation per day:
Screen Time By Age
Age is an important factor in screen time consumption. Around 3 in 4 of parents with a child aged 2 or younger claim their child watches TV.
Unfortunately, 90% of older children spend time watching a TV screen.
Impact Of Screen Time
Data from a survey of 2,000+ US adults showed that less than 50% the time spent on screens is believed to be productive.
Recent News
Related articles

72 CBD Statistics: Usage Data & Demographics
Did you know that 26% of Americans are using CBD in 2022? Here are the most fascinating CBD statistics that you probably didn’t know.

Diaper Facts & Statistics: Average Cost Of A Diaper
If you're looking for the latest diaper facts and statistics based on current studies, you've come to the right place.

79 Cell Phone/Smartphone Addiction Statistics
The average person checks their phone every 12 minutes, or approximately 80 times per day.

Cerebral Palsy Statistics, Facts, Prevalence & Demographics
New Cerebral Palsy statistics show that around 764,000 children and adults currently have Cerebral Palsy.

59 Community College Enrollment Statistics
Did you know that there are over 9 million students enrolled in community colleges in the U.S? Find more community college statistics below.

What Is the Average IQ? By Country, State, Gender & More
The average intelligence quotient (IQ) is between 85 and 115. This number can vary drastically between countries, states, and even geographical regions.

55 Addiction Statistics: Facts On Drug & Alcohol Addiction
New addiction statistics show that almost 21 million Americans have at least 1 addiction, but only 10% of them receive treatment.

Artificial Intelligence Statistics & Facts For 2023
New AI statistics show that 35% of companies are using AI and 42% of companies are exploring AI for its implementation in the future.

49 Dementia Statistics & Facts: How Common Is Dementia?
Did you know more than 6 million Americans are currently living with Alzheimer’s?

Average GPA In High School & College (Statistics)
Did you know that the average high school GPA is around 3.0, or a B average? Learn about the average GPA in this roundup of GPA statistics.

Apple by the Numbers: Revealing the Key Statistics
Discover intriguing Apple statistics, from iPhone sales to market impact, in this comprehensive analysis.
ABA Therapy Cost by State Uncovered
Discover the aba therapy cost per state, factors affecting it, and options to manage expenses.